Most police-reported crashes in the United States never become an injury file. They become a damaged vehicle, a crash report, and a property-damage claim. That is the ledger this page keeps.
This hub tracks vehicle property damage only: property-damage-only (PDO) crashes in NHTSA's Crash Report Sampling System (CRSS), property-damage liability and physical-damage claims in ISO's paid-claim tables, and hail as weather events, not as claim counts. Fatality censuses, large-truck ledgers, and settlement averages belong on other pages.
Every figure traces to the agency that produced it. Roundups are not sources. If a number cannot be found on the origin page, it is not here.
Updated SEPTEMBER 2026
!2024 police-reported crashes by severity
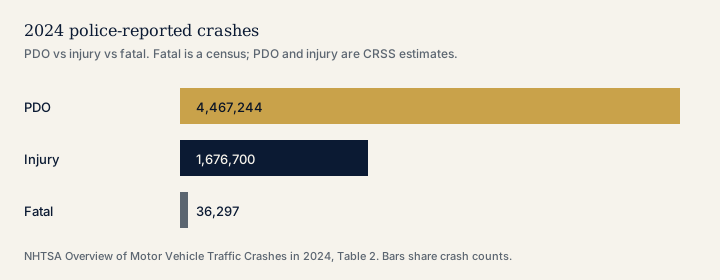
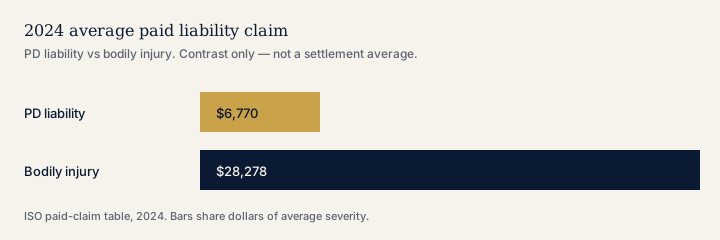
Key Takeaways - Police-reported property-damage-only crashes reached 4,467,244 in 2024 (NHTSA, Apr 2026). - All police-reported crashes totaled 6,180,241 that year (NHTSA, Apr 2026). - Injury crashes were estimated at 1,676,700 (NHTSA, Apr 2026). - Fatal crashes, a census rather than a sample, numbered 36,297 (NHTSA, Apr 2026). - Property-damage liability claims ran 2.50 per 100 earned car years in 2024 (ISO, Sep 2026). - The average paid PD-liability claim was $6,770 (ISO, Sep 2026). - Collision claims ran 4.16 per 100 earned car years (ISO, Sep 2026). - Comprehensive claims, which include glass and exclude wind and water in this ISO series, ran 3.95 per 100 earned car years (ISO, Sep 2026). - U.S. travel reached 3,294,031 million vehicle-miles in 2024 (FHWA, Feb 2026). - NICB counted 850,708 stolen vehicles nationwide in 2024 (NICB, Mar 2025). - NOAA logged 17 billion-dollar severe-storm events in 2024. Those dollars are not auto-only (NOAA NCEI, Jan 2025). - SPC recorded 382 hail reports on May 16, 2025, the year's busiest hail day in its 2025 review (NOAA SPC, Apr 2026).
!2024 average paid liability claim
How many police-reported crashes are property-damage-only? PDO is the ordinary crash. Someone calls the police. No one is counted as injured. The vehicle still has to be repaired, totaled, or driven home with a crease in the door. CRSS estimates those crashes. FARS does not.
What did the 2024 PDO count look like next to 2023? The 2024 overview's Table 2 is the current CRSS estimate paired with the 2023 Final File. PDO crashes rose 1.4 percent, a change NHTSA flags as not statistically significant (NHTSA, Apr 2026). The numeric rise was 63,791 PDO crashes (NHTSA, Apr 2026). The 2023 PDO estimate in that same table is 4,403,453 (NHTSA, Apr 2026). Fatal crash counts in Table 2 are a census and are not tested for significance. PDO counts are a sample. Treat a one-year PDO wiggle as a sample, not a verdict.
If the crash left you with a damaged car and a report, that is the file this page is built for. See whether a property-damage claim fits.
Did PDO crashes already rebound before 2024? Yes. The 2023 overview's Table 2 puts 2022 PDO crashes at 4,226,677 (NHTSA, Apr 2025). That was a 4.2 percent rise into 2023, also not statistically significant (NHTSA, Apr 2025). The 2022 overview's Table 2 puts 2021 PDO crashes at 4,335,820 (NHTSA, Jun 2024). PDO then fell 2.5 percent into 2022 (NHTSA, Jun 2024). The 2021 technical report's Table 2 is the pandemic hinge: 2019 PDO crashes were 4,806,253 (NHTSA, Apr 2023). 2020 PDO crashes fell to 3,621,681, a 25 percent drop (NHTSA, Apr 2023). They then rose 20 percent in 2021 (NHTSA, Apr 2023).
How large was the 2020-to-2021 PDO swing in counts, not percents? The 2021 table records a loss of 1,184,752 PDO crashes from 2019 to 2020 (NHTSA, Apr 2023). The next year added 714,139 PDO crashes (NHTSA, Apr 2023). All police-reported crashes rose from 5.25 million in 2020 to 6.10 million in 2021, a statistically significant 16 percent increase (NHTSA, Apr 2023). CRSS replaced NASS GES in 2016. Do not splice GES-era PDO totals onto these years as if they were one series.
Fatal vs injury vs PDO mix Keep the three buckets separate. A fatal crash is a FARS census row. An injury crash is a CRSS estimate of police-reported injury. A PDO crash is a CRSS estimate with no injured occupant or nonoccupant. Mixing them into one "accidents" number hides the property-damage file.
How did the three crash buckets move from 2023 to 2024? Total police-reported crashes in 2023 were 6,138,474 (NHTSA, Apr 2026). Injury crashes that year were 1,697,252 (NHTSA, Apr 2026). Fatal crashes were 37,769 (NHTSA, Apr 2026). Non-fatal crashes in 2024 were 6,143,944 (NHTSA, Apr 2026). Non-fatal crashes in 2023 were 6,100,705 (NHTSA, Apr 2026). Fatal crashes fell 3.9 percent (NHTSA, Apr 2026). Injury crashes fell 1.2 percent (NHTSA, Apr 2026). The total rose 0.7 percent, not statistically significant (NHTSA, Apr 2026). PDO can rise while injury and fatal counts fall. That is not a contradiction. It is three files.
What did the mix look like one year earlier? Quick Facts 2024 restates the 2022 police-reported total as 5,930,697 (NHTSA, Apr 2026). The 2023 overview's Table 2 puts 2022 fatal crashes at 39,422 (NHTSA, Apr 2025). The 2022 overview's Table 2 puts 2021 injury crashes at 1,727,608 (NHTSA, Jun 2024). 2022 injury crashes were 1,664,598 (NHTSA, Jun 2024). 2021 fatal crashes were 39,785 (NHTSA, Jun 2024). 2021 total crashes were 6,103,213 (NHTSA, Jun 2024). 2022 total crashes in that table were 5,930,496, a later-revised cousin of the Quick Facts figure. Use one vintage per comparison and say so.
What do the rates per mile show, without restating the crash counts? The 2024 fatality rate was 1.19 per 100 million VMT (NHTSA, Apr 2026). The 2023 rate was 1.26 (NHTSA, Apr 2026). The 2024 injury rate was 74 per 100 million VMT (NHTSA, Apr 2026). The 2023 injury rate was 75 (NHTSA, Apr 2026). Table 1 VMT for 2023 is 3,246,817 million miles (NHTSA, Apr 2026). VMT rose 1.5 percent into 2024 (NHTSA, Apr 2026). The 2023 overview puts 2022 VMT at 3,196,191 million (NHTSA, Apr 2025). Rates need a travel denominator. Crash counts alone do not tell you whether the road got safer or just quieter.
How much of that travel is urban, and how many vehicles are registered? FHWA Table VM-1 puts 2024 urban travel at 2,269,186 million vehicle-miles (FHWA, Feb 2026). Rural travel was 1,024,845 million (FHWA, Feb 2026). All motor vehicles registered in that table numbered 297,525,836 (FHWA, Feb 2026). Average miles per vehicle were 11,071 (FHWA, Feb 2026). The 2023 registered count in the same table is 284,614,269 (FHWA, Feb 2026). Average miles in 2023 were 11,408 (FHWA, Feb 2026). Light-duty vehicles, short and long wheelbase combined, accounted for 2,924,107 million miles in 2024 (FHWA, Feb 2026). Table MV-1's published state-sum total matches the VM-1 registered count (FHWA, Feb 2026).
Property-damage liability claims ISO's paid-claim table is not a crash census. It is claims per 100 earned car years, with severity as the size of the paid loss, including loss-adjustment expenses on the liability lines. PD liability is the other driver's car. Bodily injury is listed here only as contrast.
How often do PD-liability claims happen compared with BI? In 2024, BI liability frequency was 0.80 per 100 earned car years (ISO, Sep 2026). Average BI severity was $28,278 (ISO, Sep 2026). PD-liability frequency in 2023 was 2.59 (ISO, Sep 2026). In 2022 it was 2.54 (ISO, Sep 2026). In 2021 it was 2.28 (ISO, Sep 2026). In 2020, the low-travel year, it was 2.39 (ISO, Sep 2026). In 2015 it was 3.45 (ISO, Sep 2026). PD-liability claims are several times more frequent than BI claims in this table. Frequency is not severity. A PD claim can still be the entire case for the person whose car was hit.
If the other driver's carrier is handling the damage to your vehicle, that is PD liability, not collision. Check a property-damage claim.
How has PD-liability severity moved? Average PD-liability severity was $6,554 in 2023 (ISO, Sep 2026). It was $6,024 in 2022 (ISO, Sep 2026). It was $5,036 in 2021 (ISO, Sep 2026). It was $4,703 in 2020 (ISO, Sep 2026). It was $4,326 in 2019 (ISO, Sep 2026). It was $3,628 in 2015 (ISO, Sep 2026). The ISO note excludes Massachusetts, Michigan, and New Jersey from the PD-liability series (ISO, Sep 2026). Claim frequency is claims per 100 earned car years, and a car year is 365 days of coverage for one vehicle (ISO, Sep 2026). This is paid claims, all limits combined, not a shop's invoice and not a jury award.
Collision as vehicle physical damage Collision in the ISO physical-damage table is damage to the insured's own vehicle from a crash, measured on a $500 deductible book. It is not a product brochure. It is how often those claims are paid, and for how much.
How often do collision claims happen across the last decade? Collision frequency was 6.01 per 100 earned car years in 2015 (ISO, Sep 2026). It was 5.00 in 2019 (ISO, Sep 2026). It fell to 3.93 in 2020 (ISO, Sep 2026). It was 4.31 in 2021 (ISO, Sep 2026). It was 4.48 in both 2022 and 2023 (ISO, Sep 2026). The physical-damage block excludes Massachusetts, Michigan, and Puerto Rico (ISO, Sep 2026). Collision is the first-party cousin of PDO and PD liability. It still describes metal, not medicine.
What did collision severity do after 2020? Average collision severity was $3,377 in 2015 (ISO, Sep 2026). It was $3,854 in 2020 (ISO, Sep 2026). It jumped to $4,583 in 2021 (ISO, Sep 2026). It was $5,377 in 2022 (ISO, Sep 2026). It was $5,521 in 2023 (ISO, Sep 2026). It was $5,489 in 2024 (ISO, Sep 2026). Severity is the size of the loss, not the deductible the insured chose at purchase. Parts, labor, and vehicle values move this number. A frequency drop with a severity rise is still more dollars per crashed car.
Comprehensive as vehicle physical damage Comprehensive in this ISO series is first-party physical damage that is not a collision: theft, glass, hail, and similar perils. The footnote is the whole point. ISO excludes wind and water losses. It includes glass losses.
What does the comprehensive frequency series actually measure? Comprehensive frequency was 2.62 per 100 earned car years in 2015 (ISO, Sep 2026). It was 2.99 in 2019 (ISO, Sep 2026). It was 2.91 in 2020 (ISO, Sep 2026). It was 3.35 in 2021 (ISO, Sep 2026). It was 3.78 in 2022 (ISO, Sep 2026). It was 4.08 in 2023 (ISO, Sep 2026). Average comprehensive severity was $1,679 in 2015 (ISO, Sep 2026). It was $2,305 in 2023 (ISO, Sep 2026). It was $2,306 in 2024 (ISO, Sep 2026). Glass claims can make frequency look busy while severity stays smaller than collision. That is the table, not a shop story.
How did vehicle theft, a comprehensive peril, move in 2024? NICB reports vehicle thefts fell 17 percent from 2023 to 2024, the largest annual drop in 40 years (NICB, Mar 2025). 2023 thefts were 1,020,729 (NICB, Mar 2025). 2022 thefts were 1,008,756 (NICB, Mar 2025). 2021 thefts were 932,329 (NICB, Mar 2025). 2020 thefts were 880,595 (NICB, Mar 2025). The Hyundai Elantra was the most stolen model, at 31,712 thefts (NICB, Mar 2025). The national theft rate was 250.2 per 100,000 residents (NICB, Mar 2025). The District of Columbia's rate was 842.4 (NICB, Mar 2025). NICB is an insurance-crime file. It is not ISO comprehensive frequency, and it is not a crash count.
What does the FBI's motor-vehicle-theft file show next to NICB? The FBI's 2024 UCR summary estimates motor vehicle theft fell 18.6 percent from 2023 to 2024 (FBI, Aug 2025). Among 15,060 agencies, automobile thefts fell from 829,425 to 657,411 (FBI, Aug 2025). Truck and bus thefts fell 20.2 percent in that same-agency comparison (FBI, Aug 2025). Other-vehicle thefts fell 9.8 percent (FBI, Aug 2025). The 2023 estimated motor-vehicle-theft rate was 321.3 per 100,000 inhabitants (FBI, Aug 2025). The 2024 rate was 258.8 (FBI, Aug 2025). The 2024 rate dropped 19.4 percent from the prior year (FBI, Aug 2025). In 2023, estimated motor vehicle thefts exceeded 1,000,000 offenses for the first time since 2007 (FBI, Aug 2025). FBI and NICB will not match. Cite both. Do not average them.
Hail events Hail here is a weather report, not a comprehensive claim. SPC counts hail reports. NOAA NCEI counts billion-dollar disaster events whose losses include crops, homes, and infrastructure. Neither file is an auto-claim count. Events are not claims.
What did SPC publish for hail in 2025? SPC's 2025 year-in-review lists 24,086 total severe-weather reports (NOAA SPC, Apr 2026). May was the most active hail month (NOAA SPC, Apr 2026). June was the most active severe month overall (NOAA SPC, Apr 2026). After May 16, the next hail days were March 14 with 322 reports (NOAA SPC, Apr 2026). May 15 had 271 hail reports (NOAA SPC, Apr 2026). May 19 had 253 (NOAA SPC, Apr 2026). May 8 had 246 (NOAA SPC, Apr 2026). Those reports are preliminary Local Storm Reports with duplicates reduced. Final Storm Data is an NCEI publication. A hail report is not a glass claim.
Which named hail outbreaks appear in NOAA's 2024 billion-dollar file? NCEI's 2024 event list names "Texas Hail Storms (May 2024)" at $2,348.3 million CPI-adjusted (NOAA NCEI, Jan 2025). It names "Colorado Hail Storms and Southern Severe Weather (May 2024)" at $3,012.8 million CPI-adjusted (NOAA NCEI, Jan 2025). Those dollars are disaster losses, not auto comprehensive payments. The United States had 27 billion-dollar weather and climate disasters in 2024 (NOAA NCEI, Jan 2025). Combined cost was $182.7 billion (NOAA NCEI, Jan 2025). From 1980 through 2024, NCEI counts 403 such events (NOAA NCEI, Jan 2025). Combined cost exceeds $2.915 trillion (NOAA NCEI, Jan 2025). The 1980-2024 average is 9.0 events per year (NOAA NCEI, Jan 2025). The 2020-2024 average is 23.0 (NOAA NCEI, Jan 2025). The last three years, 2022-2024, had 73 events (NOAA NCEI, Jan 2025). Do not read those totals as crashed cars.
What these files are not This page is a property-damage ledger. It is not Conduit's injury census, not ICK's large-truck file, and not a settlement calculator. If a number prices pain, a verdict, or a truck-only crash, it does not belong here.
Is this an injury census? No. FARS is a census of fatal traffic crashes. CRSS estimates police-reported injury and PDO crashes. NHTSA's 2019 economic-cost study counted 36,500 people killed that year, which is a fatality census, not a 2024 PDO count (NHTSA, Feb 2023). That study also counted 4.5 million people injured, including unreported injuries (NHTSA, Feb 2023). About 22.9 million vehicles were damaged in 2019 (NHTSA, Feb 2023). Some 19.3 million of those vehicles, 84 percent, were damaged in PDO incidents (NHTSA, Feb 2023). Approximately 60 percent of PDO crashes were not reported to police (NHTSA, Feb 2023). Roughly 7.8 million PDO vehicles were in police reports (NHTSA, Feb 2023). Another 11.5 million PDO vehicles were not (NHTSA, Feb 2023). Police-reported PDO is the visible slice, not the whole dent.
Is this a large-truck ledger? No. NHTSA publishes separate large-truck tables. This hub does not retarget them. FHWA still has to count the trucks that share the road. Combination-truck travel in 2024 was 192,520 million vehicle-miles (FHWA, Feb 2026). Single-unit truck travel was 137,080 million (FHWA, Feb 2026). Motorcycle travel was 22,241 million (FHWA, Feb 2026). Those are exposure rows, not a truck-crash census. Light-duty short-wheelbase travel was 2,222,415 million miles (FHWA, Feb 2026). That is the passenger-vehicle travel that sits under most PDO and PD-liability files.
Do these files price a settlement? No. NHTSA's 2019 economic-cost study put property-damage losses at $115.3 billion (NHTSA, Feb 2023). Total economic crash costs were $339.8 billion (NHTSA, Feb 2023). Property damage was 34 percent of that economic total (NHTSA, Feb 2023). The economic total equaled $1,035 per person living in the United States (NHTSA, Feb 2023). Comprehensive societal harm, including quality of life, was $1.37 trillion (NHTSA, Feb 2023). Private insurers paid about 54 percent of all economic costs (NHTSA, Feb 2023). Individual crash victims paid about 23 percent (NHTSA, Feb 2023). Those are national cost accounts. They are not a case value, a diminished-value formula, or a verdict.
Methodology and Sources Figures on this page are limited to vehicle property damage: police-reported PDO crashes, property-damage liability and physical-damage claims, comprehensive perils including theft and glass, and hail as weather events. Injury-census tables, large-truck crash ledgers, NAIC average premiums, combined ratios, writer rankings, HLDI member-only PDFs, and settlement or verdict averages were cut.
Every statistic was fetched on the origin page or PDF before it was kept. III reprints ISO claim tables; ISO is the producer. NOAA NCEI disaster dollars are not treated as auto-only. SPC hail reports are not treated as comprehensive claims. CRSS estimates of PDO and injury crashes are samples. FARS fatal-crash counts are a census. ISO frequencies are paid claims per 100 earned car years, not crashes per registered vehicle.
This page is refreshed monthly. If an origin URL dies or a number cannot be re-found, the statistic is dropped rather than laundered through a roundup.
Glossary: PDO, property-damage-only crash. CRSS, Crash Report Sampling System. FARS, Fatality Analysis Reporting System. ISO, Insurance Services Office (Verisk). VMT, vehicle-miles traveled. SPC, NOAA Storm Prediction Center. NCEI, NOAA National Centers for Environmental Information. NICB, National Insurance Crime Bureau.